Plotting the inequality of sequencing coverage

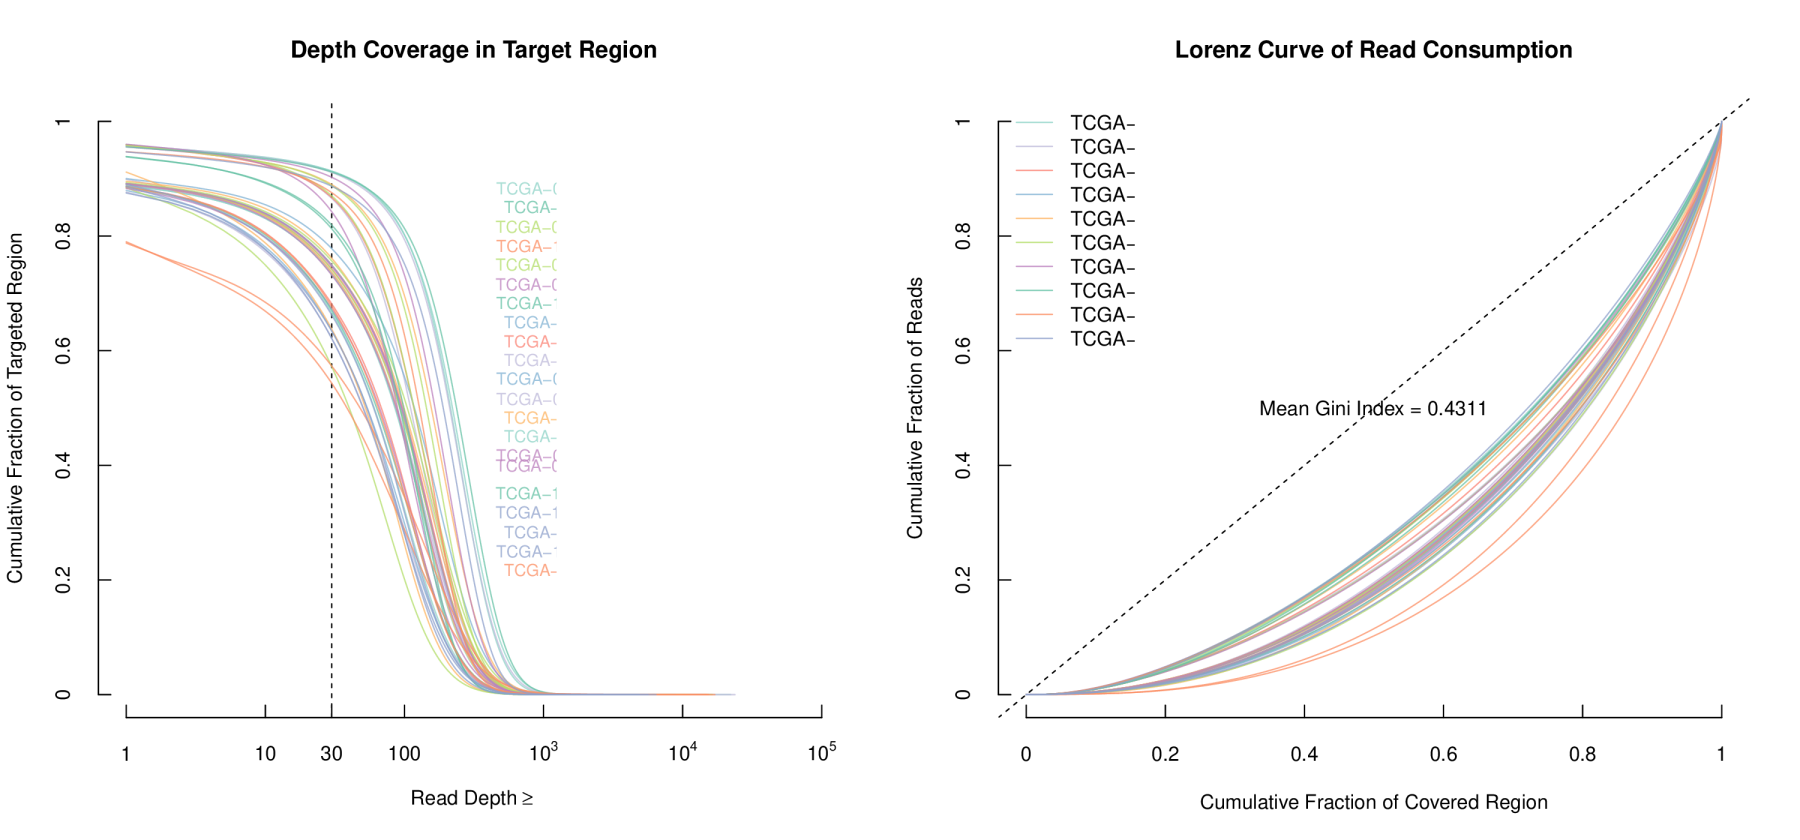
Inequality in sequencing coverage is a key factor that will lead to biases in variant detection and measurement of genomic diversity. Hence it will be beneficial to quantify the extent of such inequality before doing any fancy analyses. Exemplified here the cumulative coverage plot (left) and the Lorenz curve (right) of several whole-exome sequencing data from TCGA consortium.
Based our experience, the coverage inequality within the targeted region designed by whole-exome sequencing (around 0.35-0.45) is as severe as the current income inequality in the world. Whole-genome sequencing (without amplification) shows a better situation in this regard. Below quote from Wikipedia.
The Gini coefficient was proposed by Gini as a measure of inequality of income or wealth. For OECD countries, in the late 20th century, considering the effect of taxes and transfer payments, the income Gini coefficient ranged between 0.24 and 0.49, with Slovenia being the lowest and Mexico the highest.
 Never miss an ithgraph from us, subscribe to our newsletter